We can calculate and plot many probability distribution function using R. Let's start from basic distribution. Normally, there are 4 main application using distribution. We can evaluate PDF, CDF and quantile function. Also we can generate pseudo-random samples.
It is much simple to get these function from each distribution. The only thing we need to do is attaching specific character in front of each distribution name. For example, let's deal with normal distribution.
dnorm(x, mean, std.dev) # Evaluate the PDF at x with specific mean value and std.dev
pnorm(q, mean, std.dev) # Evaluate the CDF at q
qnorm(p, mean, std.dev) # Evaluate the quantile function at probability p
rnorm(n, mean, std.dev) # Generate n pseudo-random samples from this normal distribution
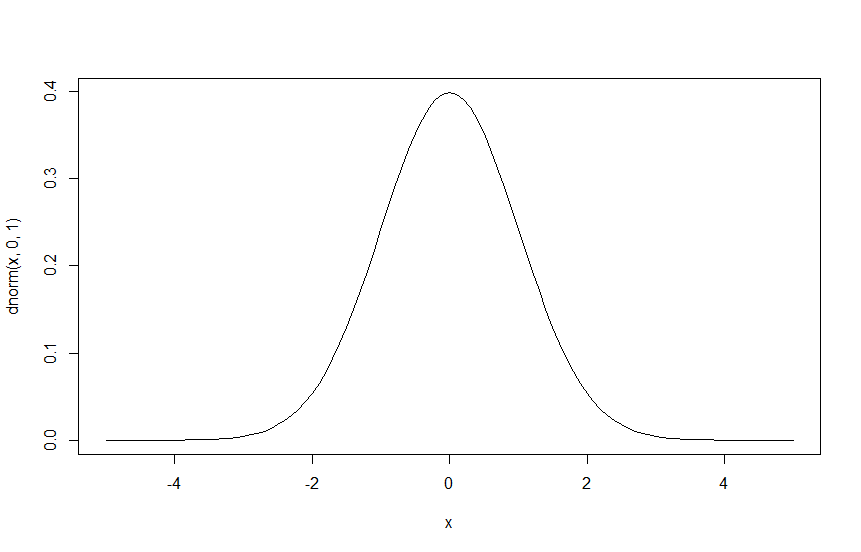
Let's see the example when the value mean value is 0 and std.dev is 1 which is standard normal distribution. We can use this function to plot the distribution easily.
dnorm(0, 0, 1) = 0.3989423 # PDF value at 0
x = seq(from = -5, to = 5, by = .1) # make x points to draw distribution
plot(x, dnorm(x, 0, 1), type="l") # connect points by line in the plot
pnorm(0, 0, 1) = 0.5 # Cumulative distribution function of 0
qnorm(.25, 0, 1) = -0.675 # .25 quantile
hists(rnorm(10000, 0, 1)) # histogram of values from rnorm(10000 pseudo random sample)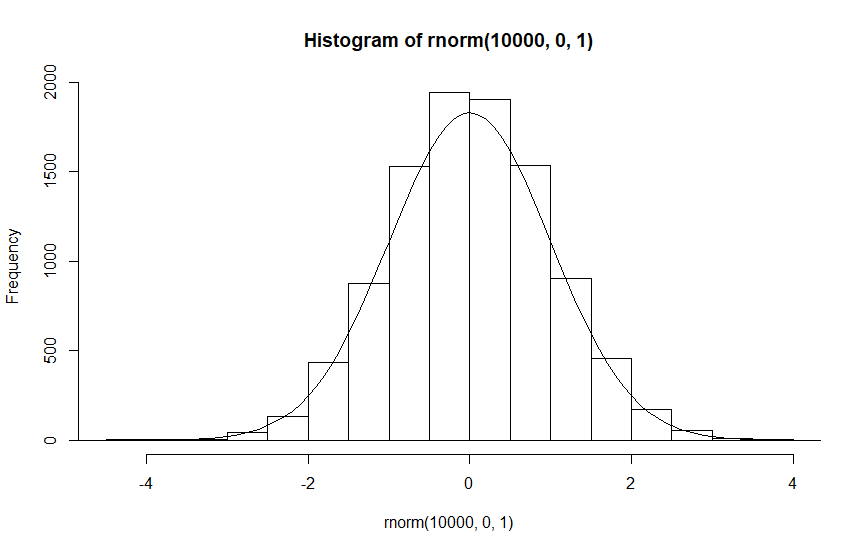
We can see the CDF, Quantile value and histogram of data when we took 10000 random sample which is fitting to normal distribution function. Like this example, we can use this method to every distribution in the R.