When we need to plot data which have two variables like image matrix, the 2D histogram can be good solution. It has several option that can make people to show the behavior of data more easier. In this post, I'll talk about how to draw 2D histogram with matplotlib which is the module for python
Implementation
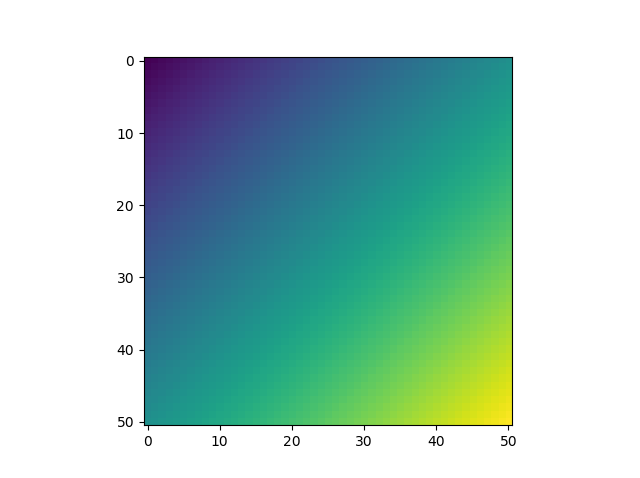
- Simple way
import numpy as np
import matplotlib.pyplot as plt
# Set matrix
x = np.arange(51).reshape(51,1)
y = np.arange(51).reshape(51,1)
z = x.T + y # Need to be 2d matrix
plt.imshow(z)
plt.show()
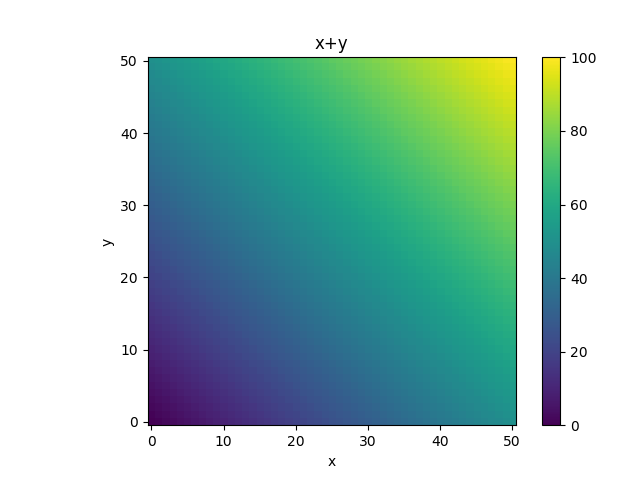
- Add axis name
plt.xlabel('x')
plt.ylabel('y')
plt.title('x+y')
- Add color bar
fig, ax = plt.subplots()
cax = plt.imshow(z)
cbar = fig.colorbar(cax) # Set colorbar
- Invert axis value
plt.gca().invert_yaxis()
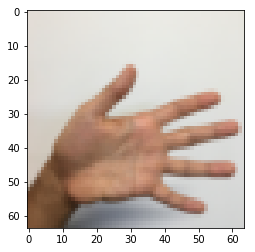
It is also possible to show image data like picture which have RGB data. The way to implement is same with previous example. What we need to do is just make matrix and set matrix as a parameter of imshow
- Show image
# Use 2D image matrix which have RGB in each pixel
plt.imshow(image_matrix)
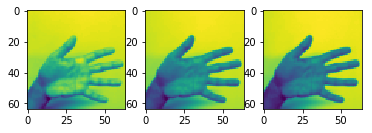
- Split image by each channel(R/G/B)
f, ax = plt.subplots(1,3)
ax[0].imshow(image_matrix[0,:,:,0])
ax[1].imshow(image_matrix[0,:,:,1])
ax[2].imshow(image_matrix[0,:,:,2])