As I said in previous post, we can use cost function to find the proper hypothesis which can explain data sets well. I brought simple data sets of woman age and height. $$\begin{array}{c} Age & Height(cm)\cr 2 & 86.4\cr 3 & 94.4\cr 4 & 101.1\cr 5 & 108.9\cr 6 & 114.6\cr 7 & 120.5\cr 8 & 126.5\cr 9 & 131.9\cr 10 & 138.4\cr \end{array}$$ If I plot this data, it will be like this.
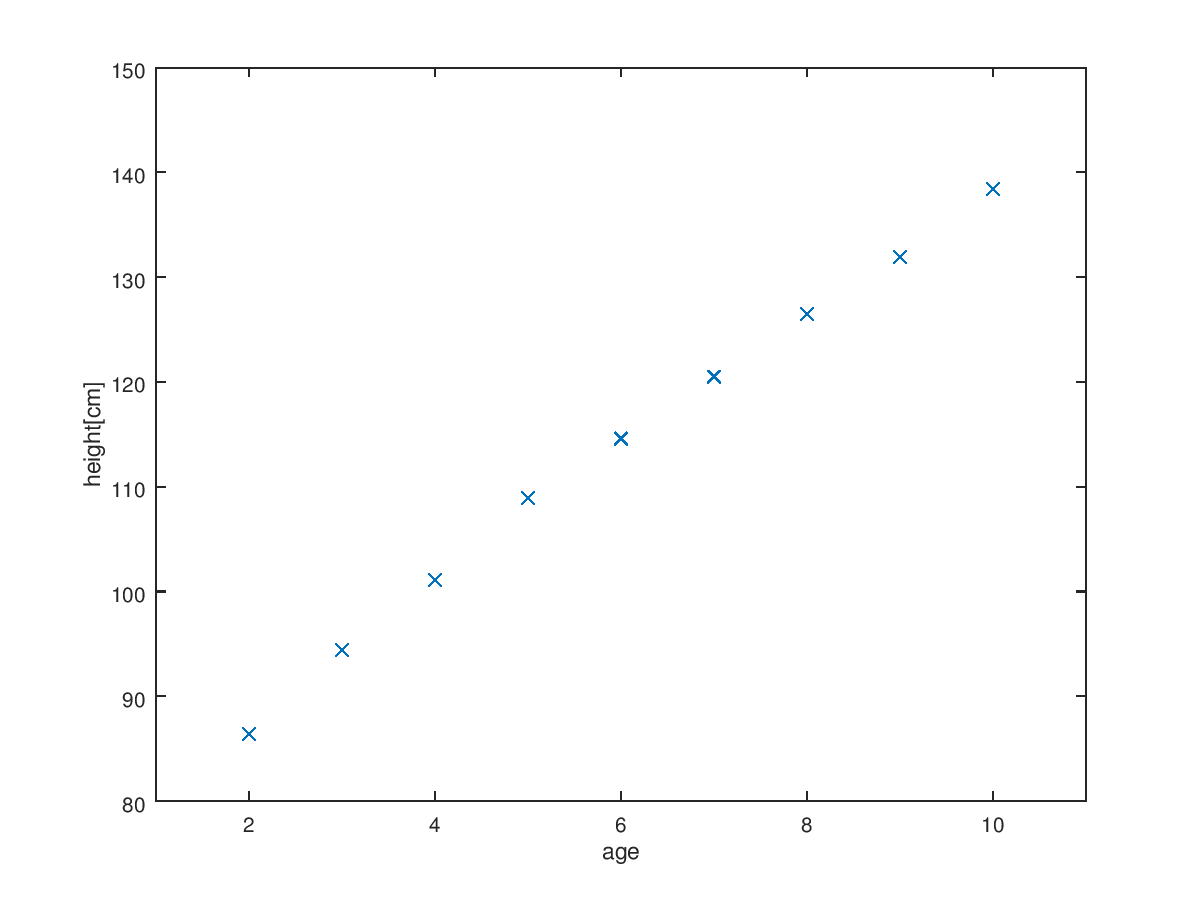
We can know there are linear relation between age and height. Then the equation of hypothesis which can explain the data sets will be linear function including two main parameters. $$h_\theta(x)=\theta_0+\theta_1 x$$ $$\theta_i \text{: parameters of models}$$ $$\text{age : input variable or feature(x)}$$ $$\text{height : output variable(y)}$$ $$\text{Each age & height set : training example}$$ Then we need to find or choose parameter theta. The strategy to choose theta is choosing theta so that hypothesis is close to our data sets. In other word, it is minimizing theta parameter to make the difference between hypothesis and y small. The simple concept can be used is squared error. $$\text{Squared error : }(h_\theta (x)-y)^2$$ $$\text{Combined squared error : }\Sigma^m_{i=1} (h_\theta (x^{(i)})-y^{(i)})^2 \frac{1}{2m}$$ $$\text{Traning sample : }(x^{(i)}, y^{(i)})$$ $$\text{The number of training sample : }m$$ The reason why dividing into 2m is make it easy to calculate. Through this consideration, we can set the definition of cost function. $$\text{Cost function : }J(\theta) = \Sigma^m_{i=1} (h_\theta (x^{(i)})-y^{(i)})^2 \frac{1}{2m}$$
If we minimize theta to make the difference smaller, it is same with minimizing cost function J. In this example, there are two parameter, 9 training example and linear model. So, we can write the cost function like this. $$h_\theta = \theta_0 + \theta_1 x$$ $$\text{Cost function : }J(\theta_0, \theta_1) = \Sigma^9_{i=1} (h_\theta (x^{(i)})-y^{(i)})^2 \frac{1}{2\cdot 9}$$
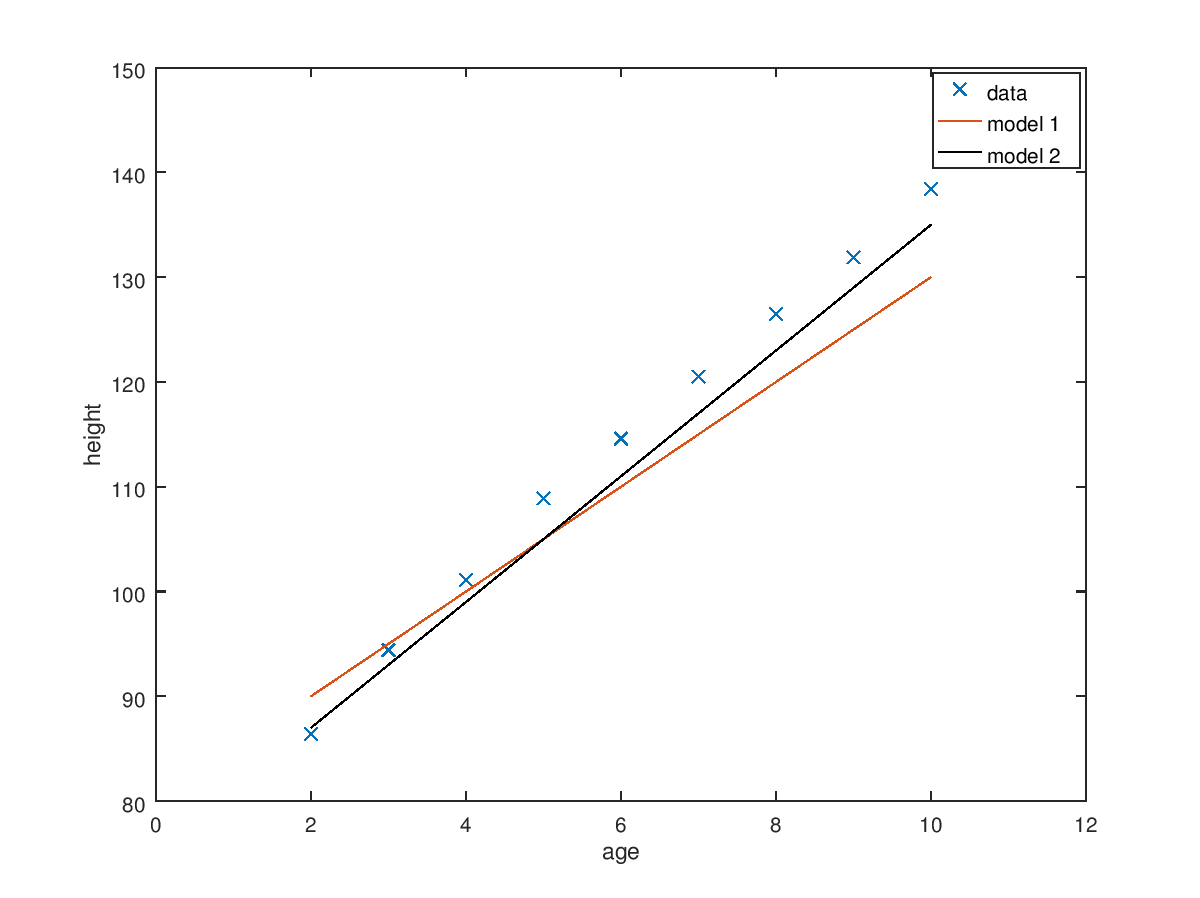
We can easily calculate each cost function value of different hypothesis parameter. And if we draw line of each model, we can see which model is fit well better. $$\text{model 1. }[\theta_0,\theta_1] = [80,5]\;J(80,5) = 13.42$$ $$\text{model 2. }[\theta_0,\theta_1] = [75,7]\;J(75,7) = 4.41$$ The process for finding best parameter is changing parameter and finding the value which can make cost function J smaller. We compared two model and calculated cost function. Depending on the value of cost function, we can say model 2 is better than model 1.