In the supervised learning, there are two main categories. One is regression which is predicting value of input value based on previous training sets. The other is classification which is classifying input value into yes or no. The example of classification is determining whether the tumor is maligant or benign. I already dealt with regression before. Simply, the classification is used when we have discrete ouput. The simplest case is two output case. Also, there are multi output case which is called multi-class problem. We can represent classification case like this $$\text{Binary class : }y \in \{0,1\}$$ $${0\text{ : Negative class}} \atopwithdelims [ ] {1\text{ : Positive class}}$$ $$\text{Multi class : }y \in \{0,1,2,3,\cdots\}$$ Let's assume that we have data which can be plotted like below figure.
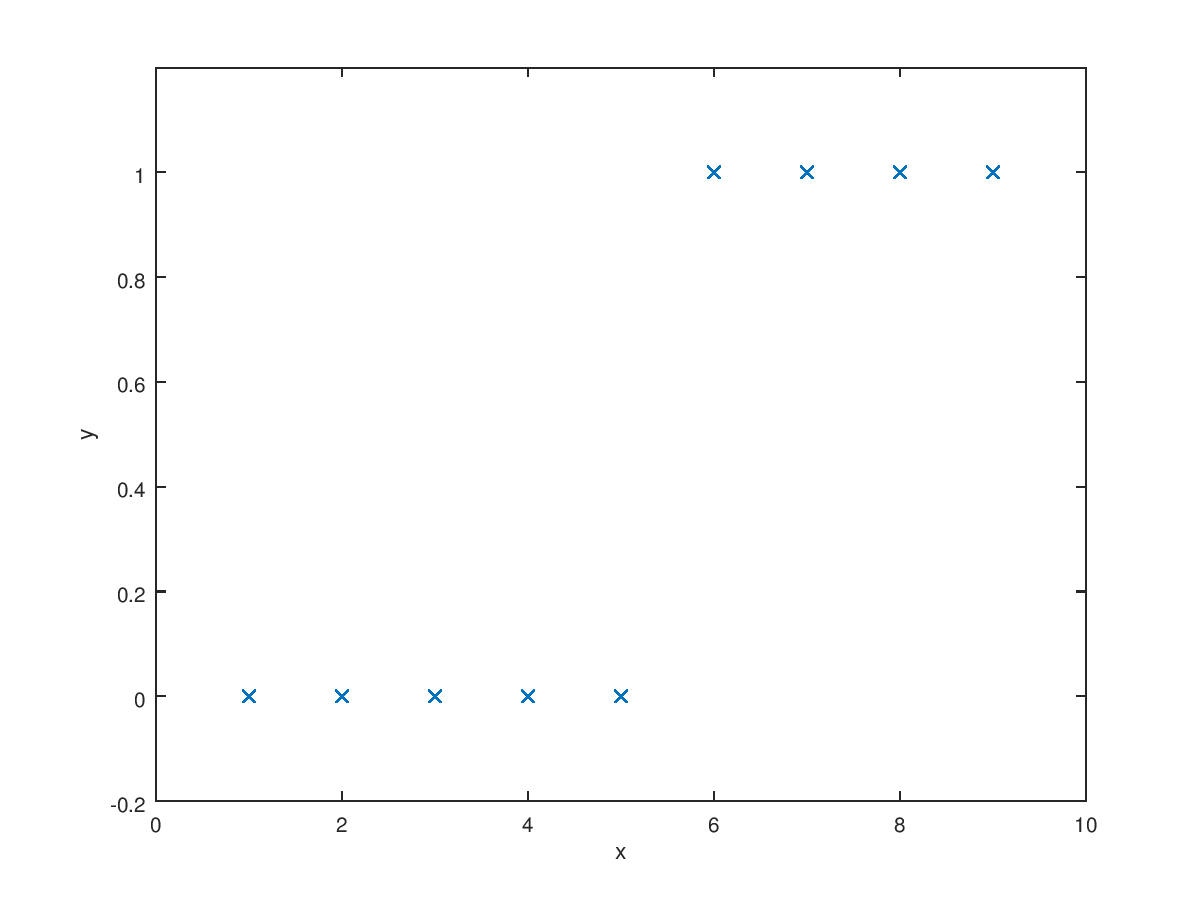
As we learned before, you may want to try use linear regression. It looks reasonable if we add some requirements that prdict "y=1" if hypothesis is larger than 0.5 and predict "y=0" if hypothesis is smaller than 0.5. However, if we add more training sets far from data sets like (30, 1), the linear regression cannot give best prediction. You can check this very simply.
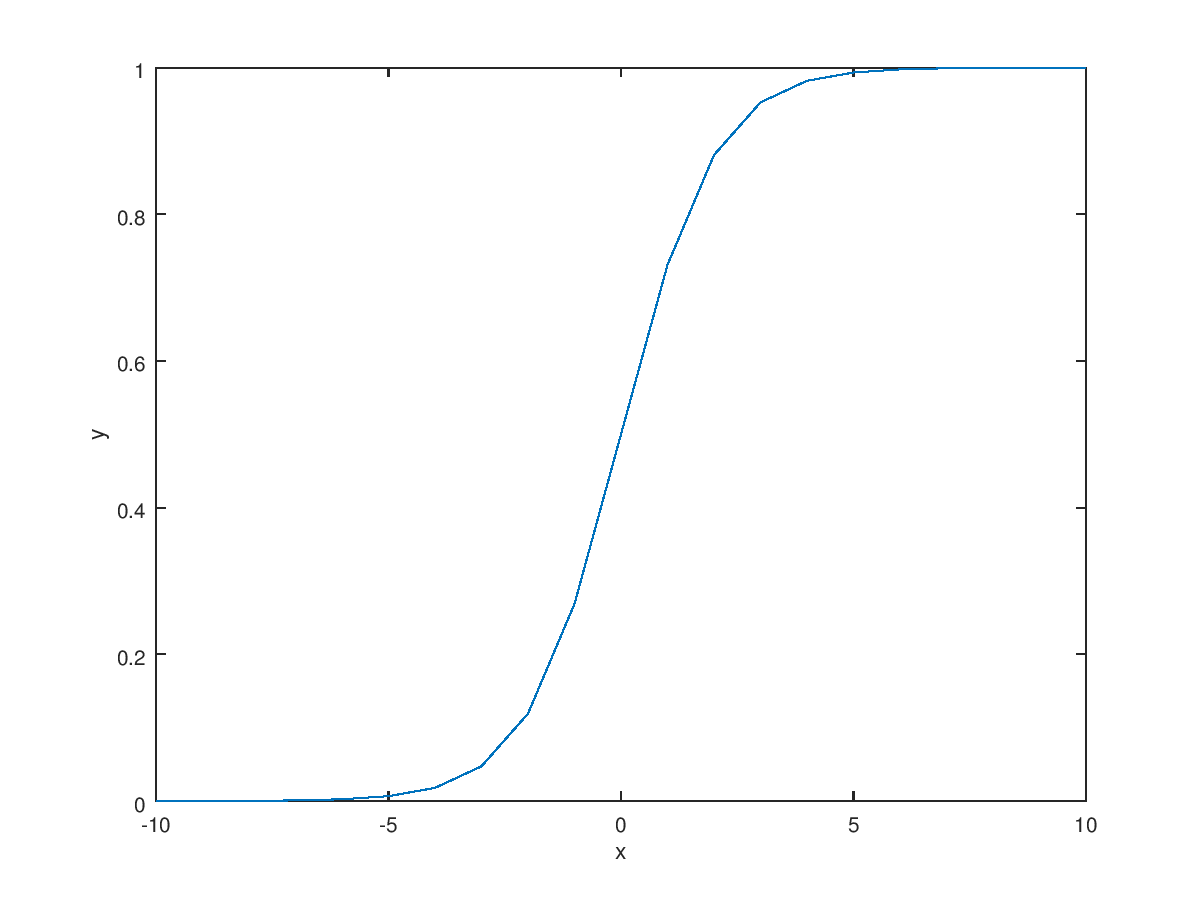
Now, we want new hypothesis model unlike linear regression. The requirement for new hypothesis is it's range is from 0 to 1 because we only have two y value (0, 1). Another requirement is it need to change its value rapidly at the threshold. The best candidates for this is logistic function or sigmoid function. Also, new regression using logistic function is called logistic regression(The reason why we use regression in classification is that the output of function is basically continuous) $$\text{Requirements : }0 \le h_\theta(x) \le 1$$ $$\text{Hypothesis : }h_\theta(x) = g(\theta^T X)$$ $$\text{Sigmoid function : }g(z) = \frac{1}{1+e^{-z}}$$ $$\longrightarrow h_\theta(x) = \frac{1}{1+e^{-\theta^T X}}$$
Then, how we can interpret the output of hypothesis? The best interpretation is probability. That is if we get the 0.6 hypothesis value, we can tell candidate have 60% chance of expected output. We can write this by equation $$h_\theta(x) = P(y=1|x;\theta)$$ $$P(y=0|x;\theta) = 1-P(y=1|x;\theta) = 1- h_\theta(x)$$ We can also bring new concept "Decision boundary". Because we have only two kinds of output 1 or 0, we need to predict result based on probability. The standard is 50% probability or 0.5 hypothesis output. If the result of hypothesis is larger than 0.5, we can predict the output is 1. $$\text{Predict }y=1\text{ if }h_\theta(x) \ge 0.5$$ $$\text{Predict }y=0\text{ if }h_\theta(x) \lt 0.5$$ In the sigmoid function, the function output become 0.5 when its input is 0. $$g(z) \ge 0.5 \text{ when } z \ge 0$$ $$h_\theta(x) = g(\theta^TX) \ge 0.5 \text{ when } \theta^T X \ge 0$$ $$"y=1" \text{ when } \theta^TX \ge 0$$ $$"y=0" \text{ when } \theta^TX \lt 0$$ $$\text{Decision boundary : }\theta^TX=0$$ The classification also can be used when the results are categorized into circular form by adding high order polynomial term.